
A registry that runs at the edge is a registry that runs far away from your security team. Who logged in to Ground Control last night? Which satellite registered this morning, and did someone change its config? Until now, answers to those questions were scattered across operational logs. Harbor Satellite now ships a dedicated security audit log: structured, transport-ready events built for compliance (SOC 2, ISO 27001), incident investigation, and SIEM integration.
The feature landed in PR #448 and covers both sides of the system: Ground Control (the central management plane) and every Satellite (the edge registry) each produce their own audit stream when enabled.
One event, one JSON line
Every security-relevant action becomes one line of JSON with a stable, transport-neutral shape:
{
  "event_id": "550e8400-e29b-41d4-a716-446655440000",
  "timestamp": "2026-05-01T10:00:00.123456Z",
  "severity": "warning",
  "component": "ground-control",
  "event_type": "session.login.failure",
  "operation": "login",
  "resource_type": "session",
  "outcome": "failure",
  "actor": "alice",
  "actor_type": "user",
  "source_ip": "10.0.0.5",
  "reason": "bad_password"
}
The schema has 17 fields: 8 always present (event_id, timestamp, severity, component, event_type, operation, resource_type, outcome) and 9 optional ones that are simply omitted when empty (actor, source_ip, request_id, details, and friends). event_type is always {resource_type}.{operation}.{outcome}, so identifiers like user.delete.success are stable strings you can safely build alerting rules on.
The catalogue today covers logins (with low-cardinality failure reasons like bad_password and account_locked - ready-made for brute-force alerts), user lifecycle, satellite register/deregister and auth failures, and config changes. Config updates even carry a field-by-field diff in details.changed, with every secret value replaced by [REDACTED] before anything is written. The full field reference and event catalogue live in the audit logging guide.
From event to SIEM: two transports
Audit events are only useful if they reach the systems your security team actually watches. Two transports ship today, and they can run at the same time:
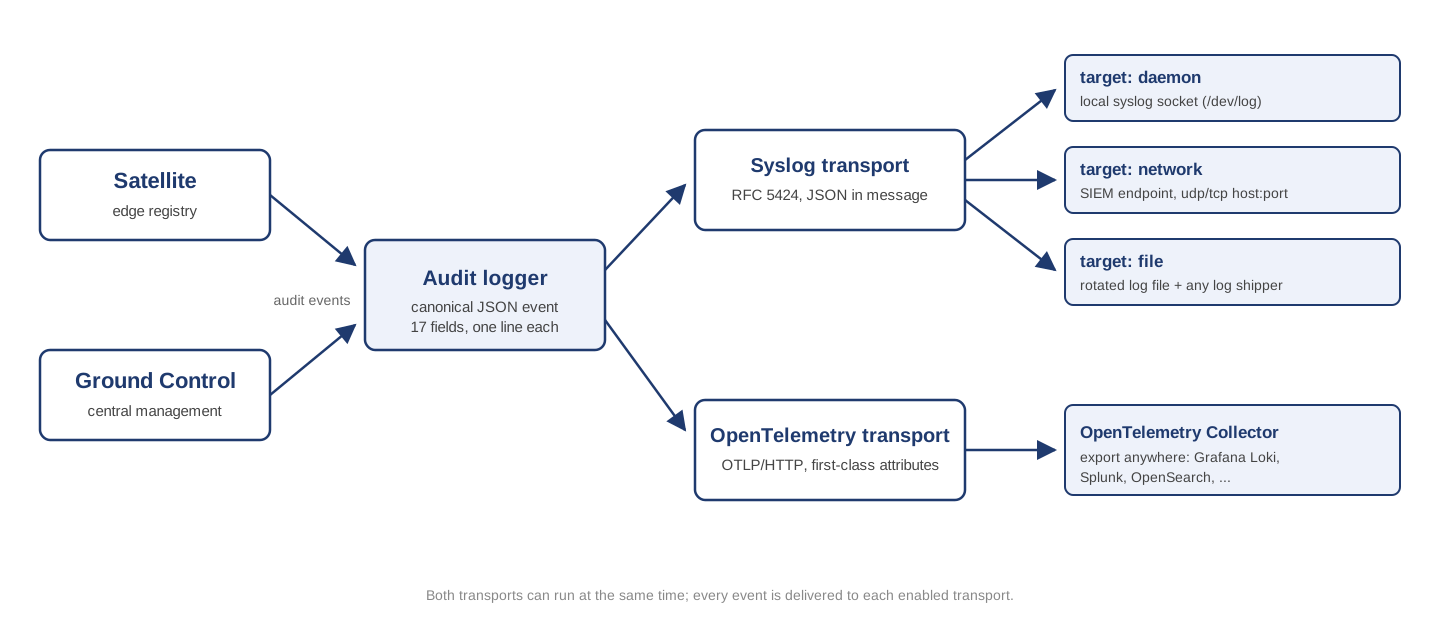
Syslog, with three targets
The syslog transport wraps each JSON event in an RFC 5424 header and gives you three interchangeable destinations via syslog.target:
daemon- hand events to the local syslog daemon over/dev/log. The OS takes it from there.network- send RFC 5424 messages straight to a SIEM endpoint over UDP or TCP (host:port). We verified this end to end against vanilla Wazuh and Splunk.file- write to a local file with built-in rotation (size, count, age, gzip). Perfect for air-gapped edge locations: pair it with any log shipper such as Filebeat, Vector, or Fluent Bit.
This is what the file target produces - a real line captured during testing, RFC 5424 header first, canonical JSON as the message body:
<132>1 2026-06-14T13:28:23.215241Z hp harbor-audit 64632 - - {"event_id":"c05f9cff-b1bd-425e-806a-b6fe98d8492c","timestamp":"2026-06-14T13:28:23.215241856Z","component":"ground-control","event_type":"session.login.failure","operation":"login","resource_type":"session","outcome":"failure","severity":"warning","actor":"admin","actor_type":"user","source_ip":"::1","user_agent":"curl/8.19.0","request_id":"8166062c-ae51-4212-8994-4eb5c83950d8","reason":"bad_password"}
Note the <132> priority: severity maps onto the syslog PRI value, so a failed login already arrives as a syslog warning without any SIEM-side rules.
Enabling it on a satellite is one block in the config JSON (Ground Control uses matching AUDIT_* environment variables):
"audit": {
  "enabled": true,
  "syslog": {
    "target": "file",
    "tag": "harbor-audit",
    "file": {
      "path": "/var/log/harbor-satellite/audit.log",
      "max_size_mb": 100,
      "max_backups": 7,
      "max_age_days": 30,
      "compress": true
    }
  }
}
The syslog catch: your SIEM sees a blob
Syslog delivers the event, but out of the box most SIEMs treat the JSON message body as one opaque string. Here is vanilla Splunk receiving our audit events over syslog - the events are there, but none of the JSON fields are extracted, so you cannot filter on actor or event_type without writing a parsing rule first:
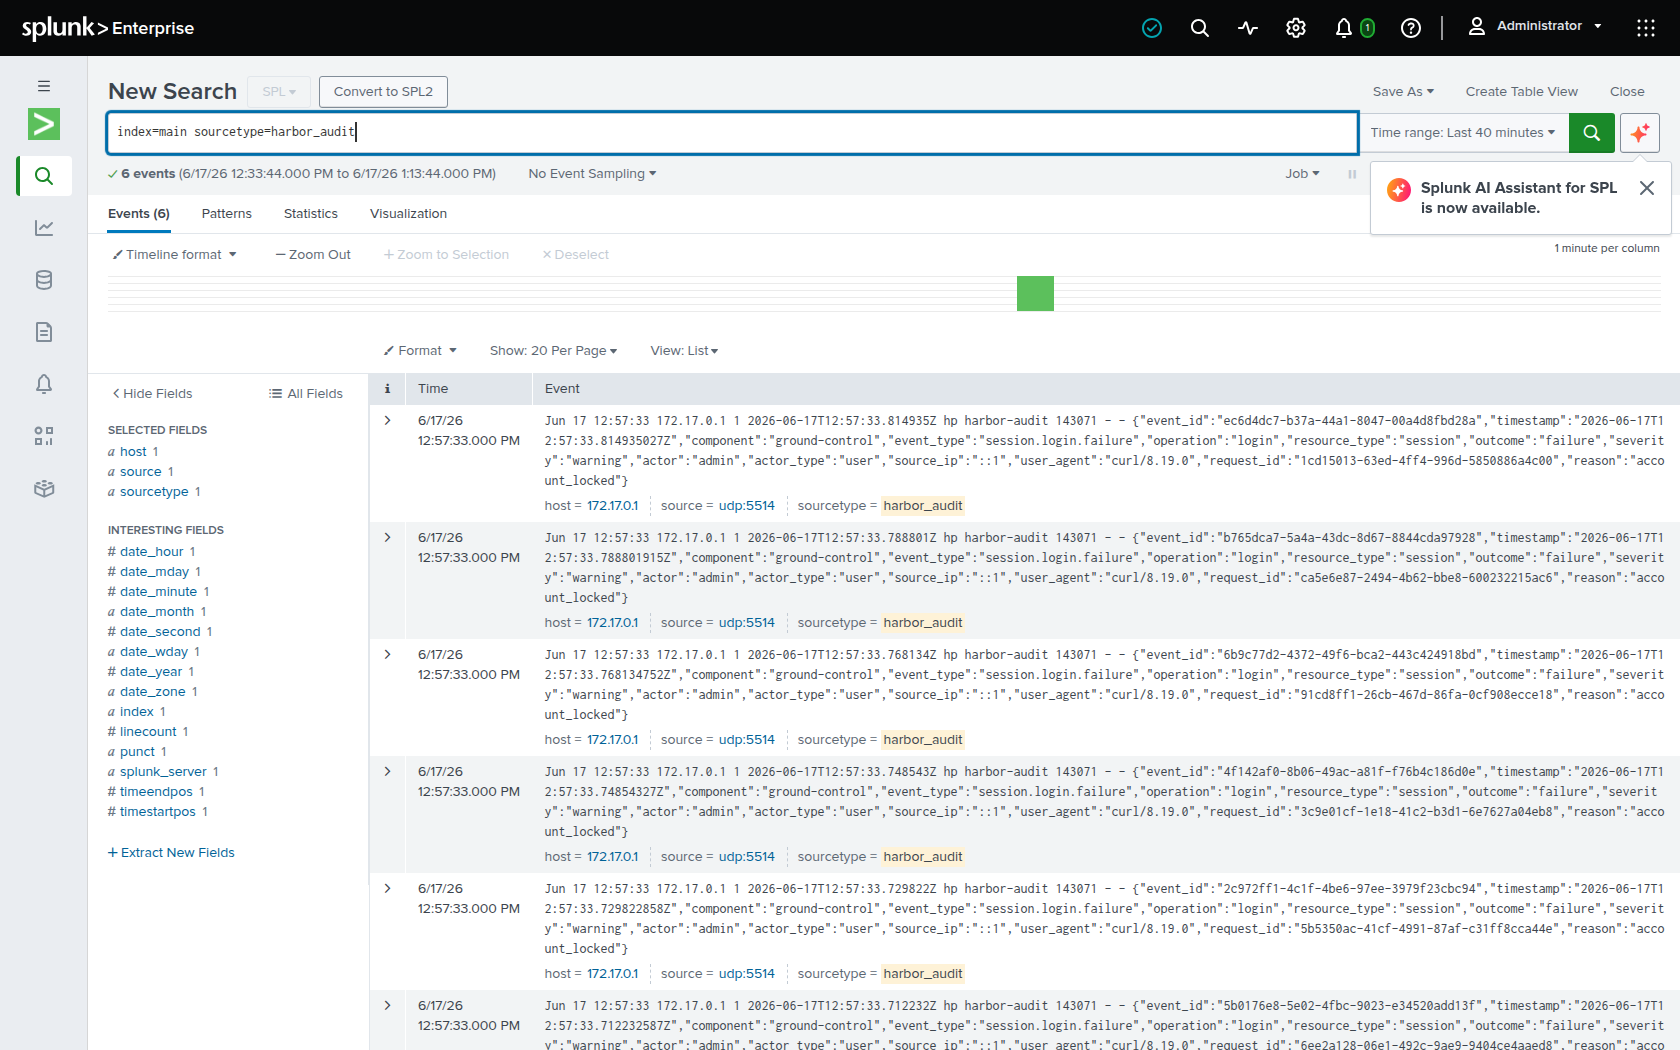
This is not a Harbor Satellite quirk - it is a documented, industry-wide gap in how SIEMs ingest JSON-over-syslog. Every syslog pipeline eventually needs a decoder or parse step.
OpenTelemetry: fields arrive parsed
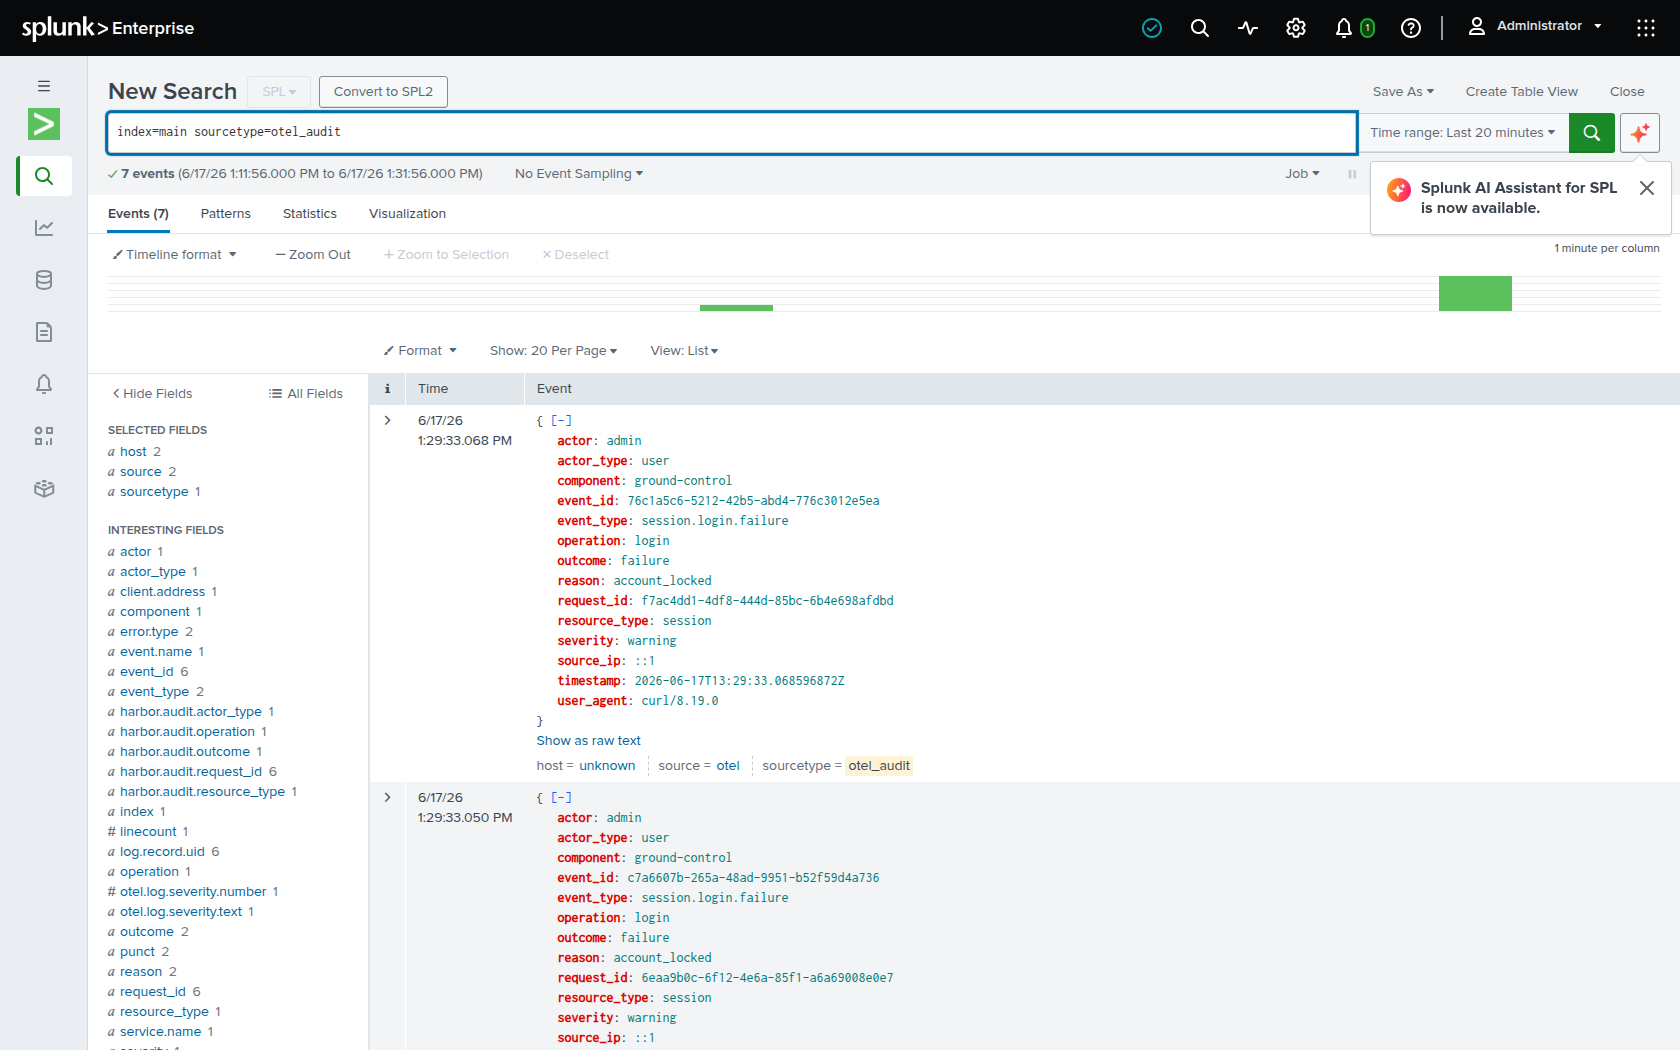
That gap is exactly why the second transport exists. With otel.enabled: true and an endpoint, events go out over OTLP/HTTP to any OpenTelemetry Collector. Instead of a string blob, the fields map onto OTel semantics without renaming: severity becomes the severity number, component becomes service.name, and event_type, actor, outcome, and reason become first-class attributes (event.name, user.name, harbor.audit.outcome, error.type).
Same Splunk, same events, delivered through the OpenTelemetry Collector instead - every field is searchable with zero custom parsing:
From the edge to a Grafana dashboard
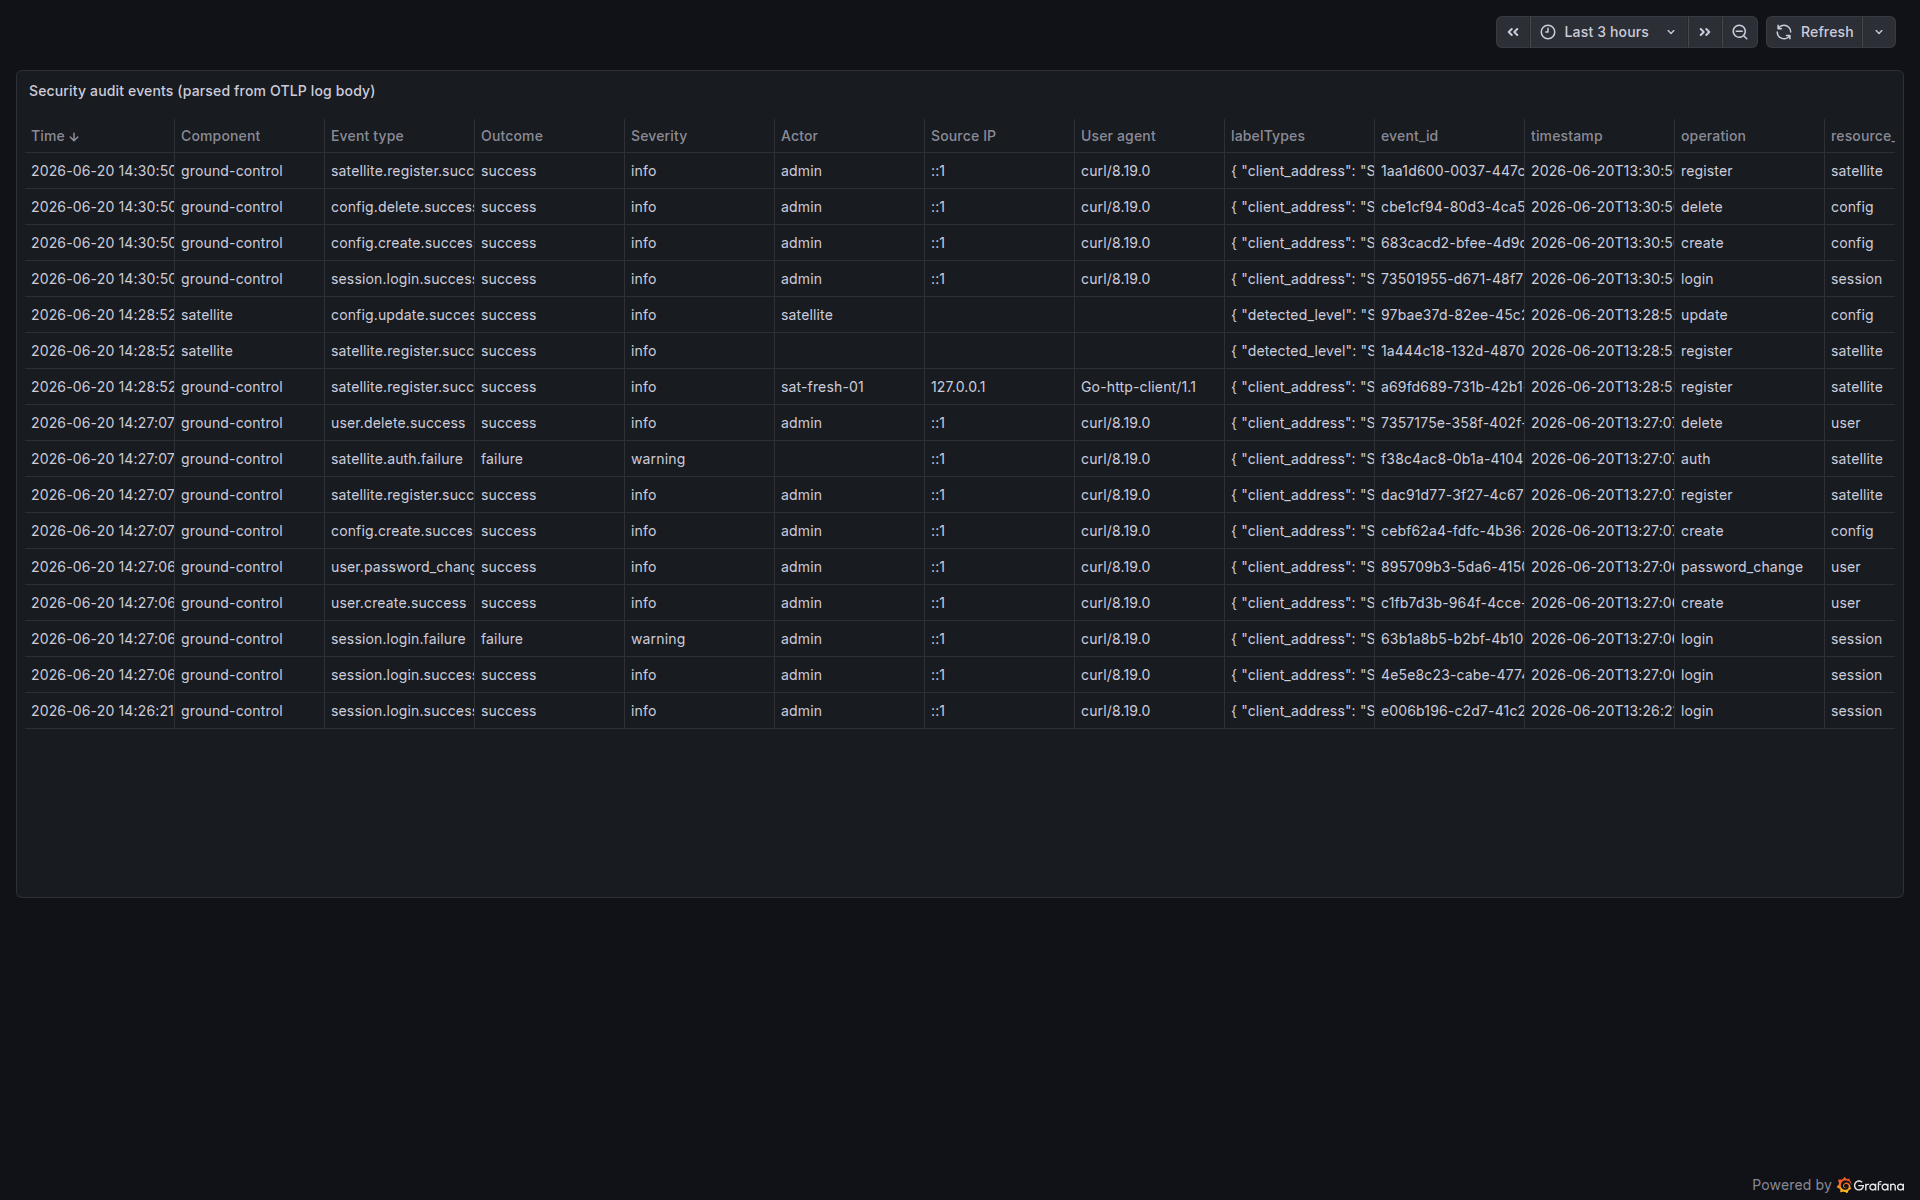
To prove the pipeline end to end, we pointed both components at an OpenTelemetry Collector exporting to Grafana Loki, triggered real activity (logins, failed logins, user and config changes, satellite registrations), and built a small dashboard on top:
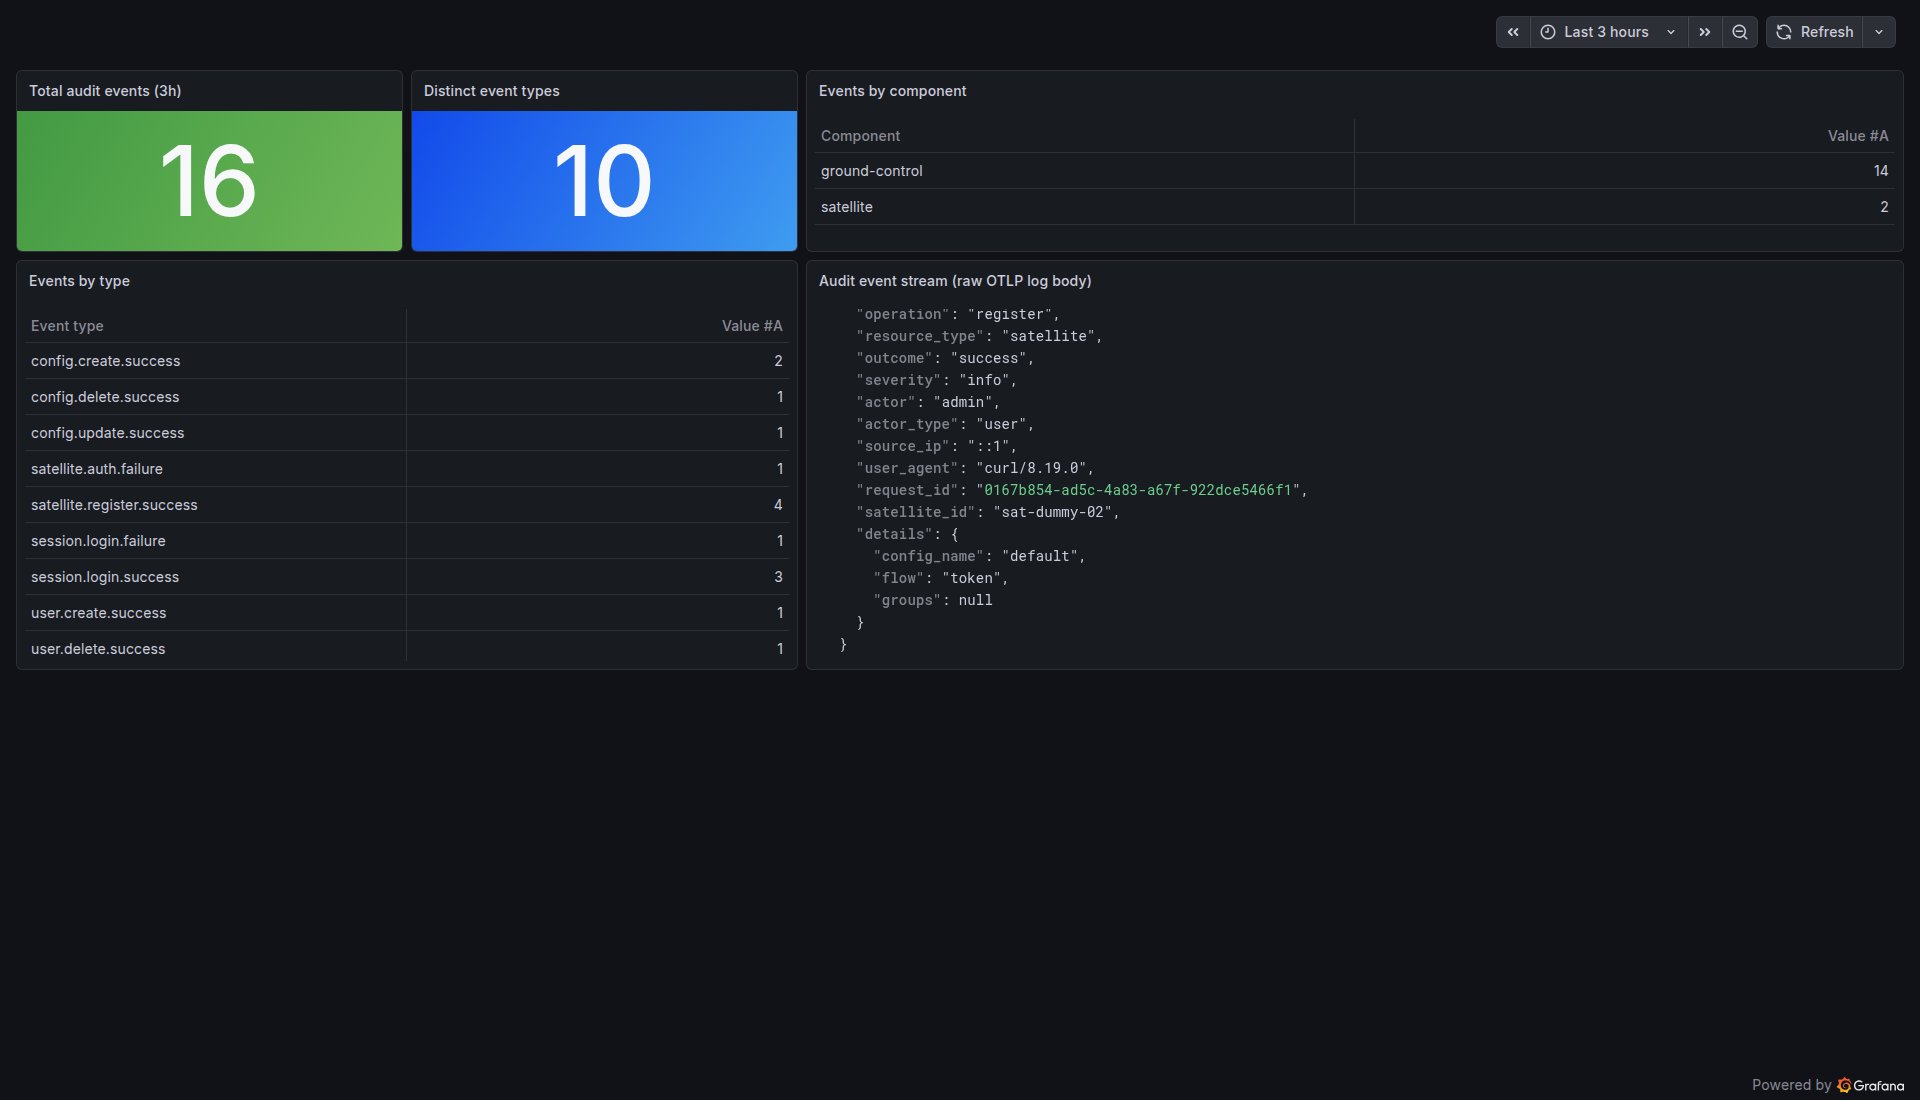
Every event lands with its fields intact, from both components, filterable by any column:
Getting started
Audit logging is off by default and costs nothing while disabled. Once you enable it, you choose the transports: syslog, OpenTelemetry, or both. The syslog transport is on by default whenever audit logging is enabled; the OpenTelemetry transport is enabled explicitly. Either one can also run alone - turn syslog off and OTel becomes the only (and then required) transport. The one hard rule: at least one transport must be on, and each transport is verified up front (the file must be writable, the SIEM address and the OTel collector reachable), otherwise the component refuses to start rather than silently dropping security events.
Enabling audit on a Satellite
The audit block goes in the app_config section of the satellite’s config.json. This example turns on both transports - syslog to a rotated local file, plus OTLP/HTTP to a collector:
"audit": {
  "enabled": true,
  "syslog": {
    "target": "file",
    "file": { "path": "/var/log/harbor-satellite/audit.log" }
  },
  "otel": {
    "enabled": true,
    "endpoint": "http://otel-collector:4318"
  }
}
Omitted fields keep their defaults (target defaults to file, rotation to 100 MB / 7 backups / 30 days / gzip). For an OpenTelemetry-only setup, add "syslog": { "enabled": false } and keep the otel block - that explicit false is what turns syslog off.
Enabling audit on Ground Control
Ground Control reads the same knobs from environment variables (see ground-control/.env.example). This is the equivalent both-transports setup:
AUDIT_LOG_ENABLED=true
AUDIT_SYSLOG_TARGET=file
AUDIT_SYSLOG_FILE_PATH=/var/log/ground-control/audit.log
AUDIT_OTEL_ENDPOINT=http://otel-collector:4318
Note the difference from the satellite: on Ground Control there is no separate OTel enable flag - a non-empty AUDIT_OTEL_ENDPOINT is what switches the OTel transport on, and leaving it empty disables it. Syslog is on by default here too; set AUDIT_SYSLOG_ENABLED=false to export only over OpenTelemetry.